
Observability
Overview
F5 Distributed Cloud generates detailed telemetry for infrastructure, applications, connectivity, and security services across a distributed environment. This telemetry helps NetOps, DevOps, and application teams troubleshoot and optimize their applications without additional burden on application developers.
Telemetry data types
Distributed Cloud collects four types of telemetry data: logs, metrics, alerts, and events. Access logs are sampled regularly, while security events and audit logs aren't. However, to protect Distributed Cloud, security events may be sampled in cases of extreme load.
You can use logs for a variety of use cases. For example, use logs to determine anomalies, analyze application APIs, identify security issues, monitor resilience, and ensure optimal performance.
Retention policy
Logs, metrics, alerts, and events are automatically stored by Distributed Cloud for each tenant and can be accessed using API. F5 retention policy is set to store each item for the following time periods:
- Security Events: 30 days
- Audit Logs: 30 days
- Request Logs: 7 days
If you need to access logs older than the supported retention period, F5 recommends that you use the Global Log Receiver (GLR) to export logs to SIEM solutions, such as Splunk or Datadog, or one of several log collection systems, and store them where it's convenient. Logs include all system and application logs from the Regional Edge (RE) and Customer Edge (CE).
Note: The logs and security events sent to external SIEM or storage through the GLR are also subject to sampling. The payload in the HTTP request and response logs are captured only for API discovery use cases. PII contents are masked before storage in accordance with Payment Card Industry Data Security Standard (PCI DSS).
For more details, see the Monitoring guide.
Data masking in observability data
Distributed Cloud detects and masks certain sensitive data fields in the headers, URL path, URL query parameters, and payloads in access log data.
Masking is used to protect sensitive data. This masking protects sensitive data in logs before it's stored or surfaced in dashboards. Masking is a one-way transformation. The original value isn't retained and can't be recovered from the masked output. Masking replaces the original value with a same-length filler value, or a one-way hash, depending on the field type.
Masking applies only to access log data in Distributed Cloud. It doesn't modify or alter customer application traffic (the data path). To protect sensitive data within application traffic, see Configure Data Guard.
On F5 Distributed Cloud, enable the API Discovery feature to make additional controls available for sensitive data discovery and compliance.
On the RE, the masking of PCI DSS fields and secrets (OTP, JWT Token) is always enabled. Custom query parameters can be configured for masking. See K000147260: How to mask sensitive information in the logs.
If you deploy a CE, you can turn on Log Anonymization. In the Distributed Cloud Console, go to your Secure Mesh Site object > Network Security > Log Anonymization drop-down menu. When turned on, access logs transmitted from the CE Distributed Cloud are masked before leaving the customer premises. Masking on the CE helps address data masking or anonymization requirements defined by many compliance frameworks.
The list of predefined data types in compliance frameworks is published on the Distributed Cloud Console. Go to Web App & API Protection > API Security > Data Types. The data type properties indicate classification as personally identifiable information (PII). The value is masked if the data type is classified as PII. If needed, you can configure custom fields and add them to the list of fields to mask.
Predefined sensitive data type definitions are available for the following compliance frameworks:
- Act on the Protection of Personal Information (APPI)
- California Consumer Privacy Act (CCPA)
- Colorado Privacy Act (CPA) Colorado (CPA CO)
- California Privacy Rights Act (CPRA) 2023
- Data Protection Act United Kingdom (DPA UK)
- ePrivacy Directive
- General Data Protection Regulation (GDPR)
- Gramm-Leach-Bliley Act (GLBA)
- Health Insurance Portability and Accountability Act (HIPAA)
- ISO/IEC 27001
- General Personal Data Protection Law (LGPD)
- PCI DSS
- Personal Data Protection Act (PDPA) Singapore
- Personal Information Protection and Electronic Documents Act (PIPEDA)
- System and Organization Controls 2 (SOC 2)
- Sarbanes-Oxley Act (SOX)
Enable observability on Distributed Cloud
F5 Distributed Cloud collects logs, metrics, alerts, and events from our global infrastructure, as well as each of the Distributed Cloud Customer Edge Nodes deployed by users in their on-premises, cloud, and edge locations.
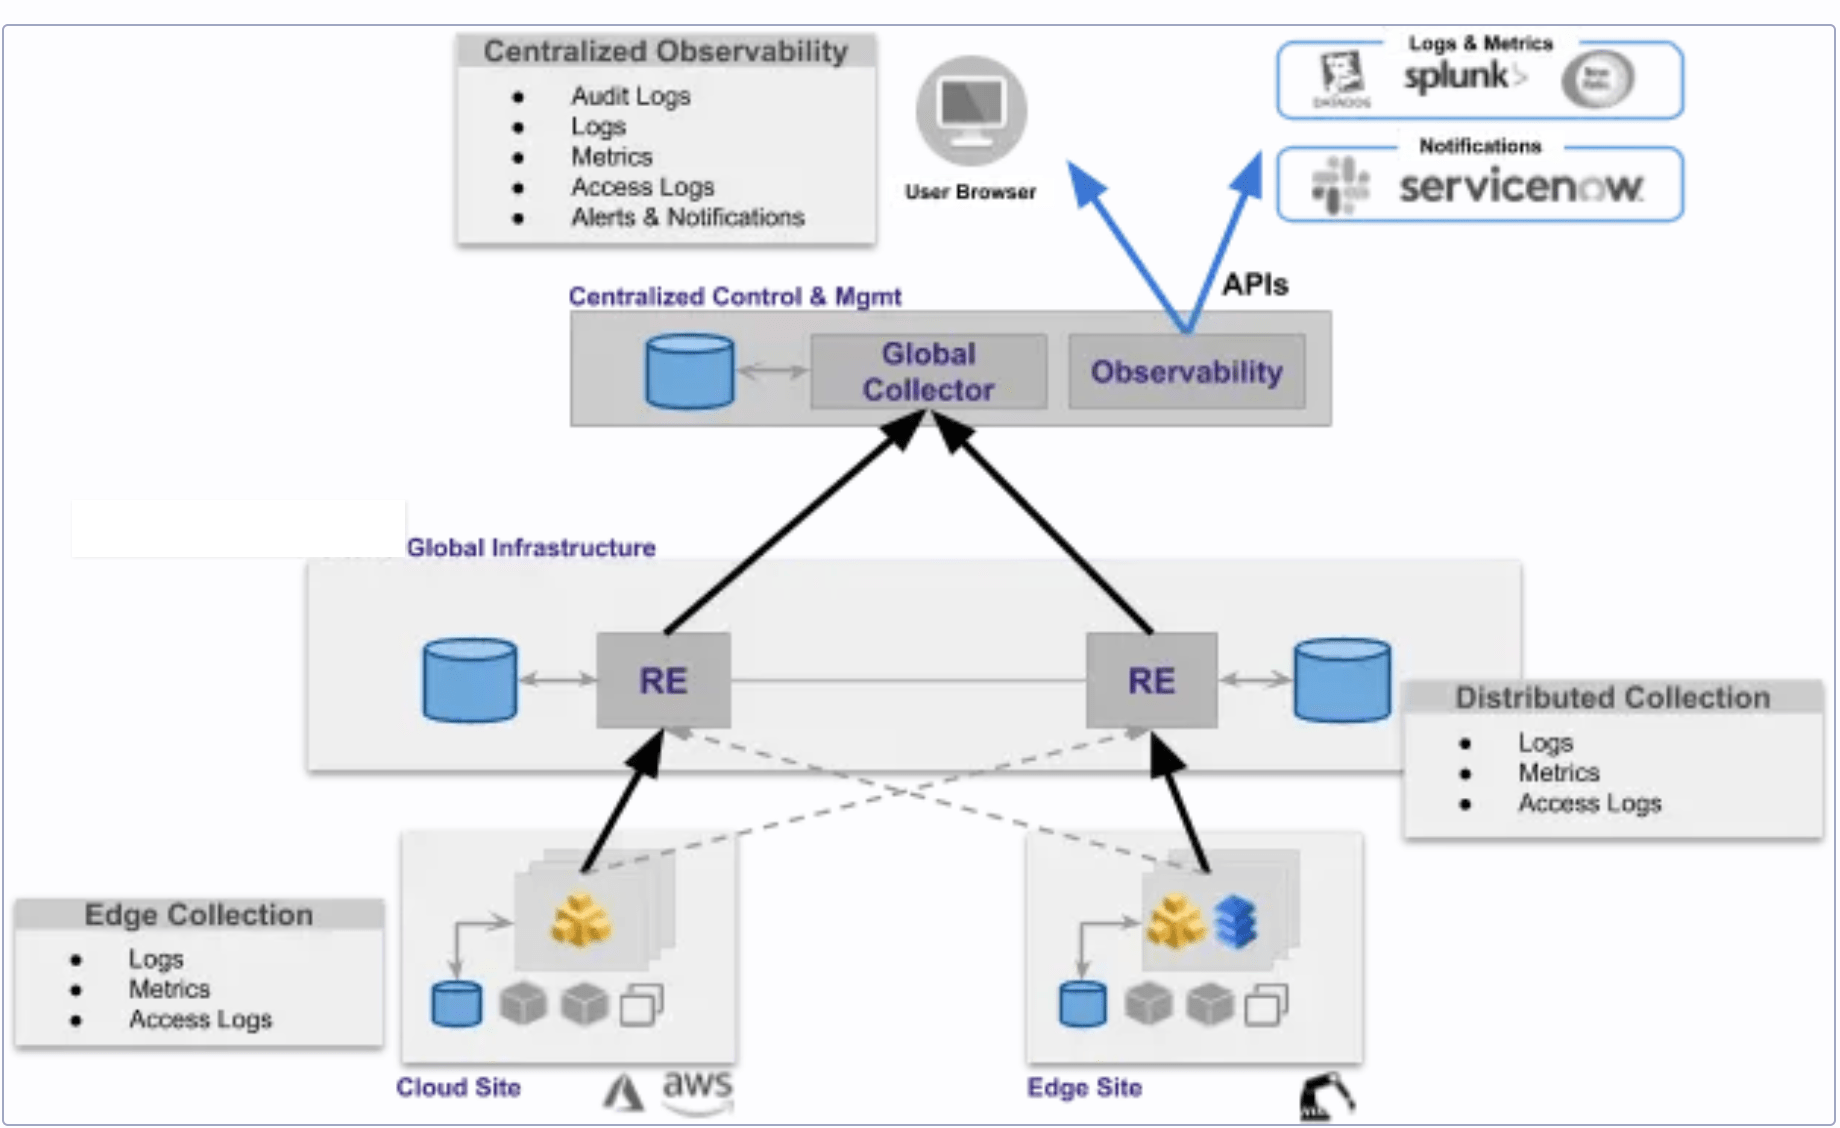
Figure: High-Level View of Observability System
You can use two methods to get observability into your applications and services:
- Use centralized dashboards in the Distributed Cloud Console.
- Use Distributed Cloud APIs to integrate with third-party tools.
Four different types of telemetry and observability data are collected from distributed sources and aggregated by the system:
-
Logs: There are three types of logs that are aggregated across the system - system logs, application logs, and access logs (request and response). The applications logs are not automatically stored by the system at this time, so you need to decide how to handle their storage. Access logs are sampled and viewed using the Access and Audit Log API.
-
Metrics: There are many time-series metrics for the infrastructure (CPU, memory, disk, interfaces, connectivity, and latency), applications, and application services (deployment status, application health, request rate, errors, duration, latency, and throughput) that are collected by the system.
-
Alerts: Alerts can be related to user services (for example, application restart, site connectivity lost, out of memory) or infrastructure services (for example, service restart, connectivity errors). Alerts are available in the dashboard and can be integrated with external systems, like Pagerduty, using the APIs. Some alerts related to infrastructure services are handled and mitigated automatically by the SRE team, and may be viewed using the Alerts API.
-
Security Events & Audit Logs: These logs record events related to access and change of configuration resources. These are security related chronological records that can be used to identify who, when, and what changes to the configuration of an object were made. Security events and audit logs are not typically sampled, and can be viewed using the Security Event API and Access and Audit Log API.
This telemetry data provides different outcomes to different types of users:
-
F5 Distributed Cloud Site Reliability Engineers (SRE): F5 SREs ensure that customer services and F5 global infrastructure are operational and meet the service level objectives.
-
Customer Operations: Operations teams can use telemetry data for observability of their infrastructure, network, applications, and end-users of their applications. There is a rich amount of visibility available on the Distributed Cloud Console for instant visualization of this data as well as APIs available that you can use to integrate with other tools.
-
Customer Application Teams: Application teams can use telemetry data to get observability of application and network services that relate to their specific applications.
-
Third Party Integrations: You may need to send certain logs and metrics to external systems for compliance, end-to-end visibility, and alerting purposes. Some examples are ServiceNow, Pagerduty, Splunk, NewRelic, Sumologic, and DataDog, and more. You can use Distributed Cloud APIs to integrate most of the commonly used external systems.
Observability data is available to you with:
-
Distributed Cloud Console: You can access various dashboards and graphs relating to their infrastructure and applications.
- In the Infrastructure (system) namespace, you have access to visualizations, like site map, site connectivity, and site dashboard.
- In the respective application namespaces, you have access to visualizations, like application sites, application deployments, virtual host dashboard, service mesh graph, security dashboard, and application traffic graph.
-
APIs: Use APIs to collect infrastructure and application logs, metrics, alerts, and events. A graph query API provides metrics for interactions across services. You can use these APIs to interface with external systems, like Splunk or Datadog.
References
For more information, see: